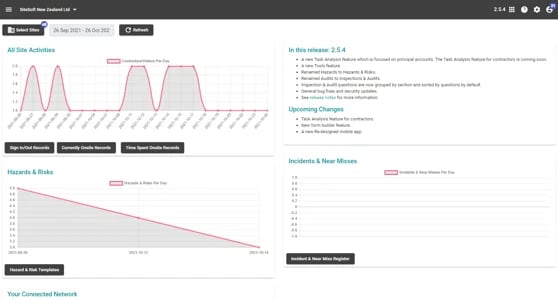
When you first log into SiteConnect you will see your Dashboard pop up which should look something like this.
Index:
Project/Site Activities:
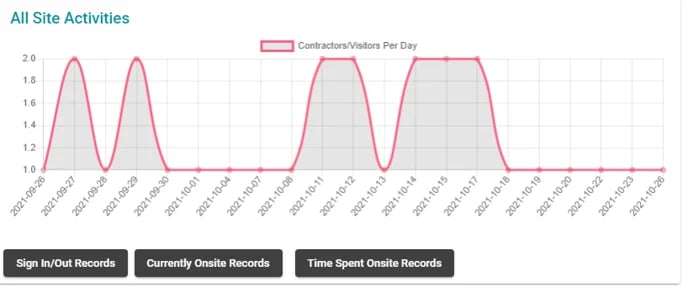
The first thing you may notice is the graph at the top labelled All Site Activities. This shows in line graph format, how many Contractors/Visitors have been visiting your sites per day.
To filter a specific Site's results, you can select which Projects/Sites show up by clicking the Select Sites button above the graph. This will be defaulted to show all Projects/Sites.
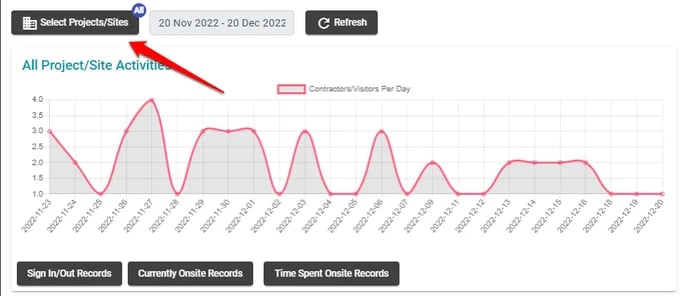
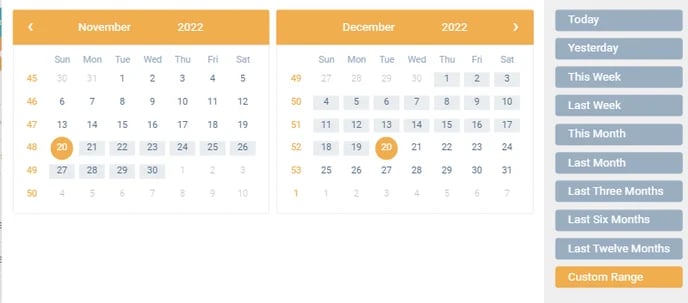
You can also select the date ranges that this data is showing in the box next to the Select Sites prompt. A calendar view will then appear whereby you can select the beginning and end date for this report.
You can also Refresh the report after these changes have been made by clicking Refresh.
![]()
Once you have selected the appropriate Sites and date ranges the data in the line graph should then change to reflect these filters.
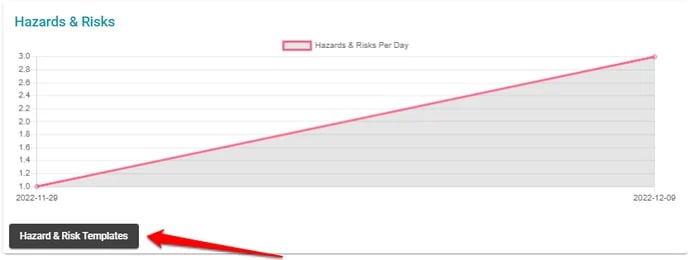
Hazards & Risks
Further down the Dashboard , you will see another graph showing your how many Hazards/Risks are logged per day. You will also be able to access your Hazards & Risk Templates menu by clicking the button below this graph. For more about this feature, please click here.
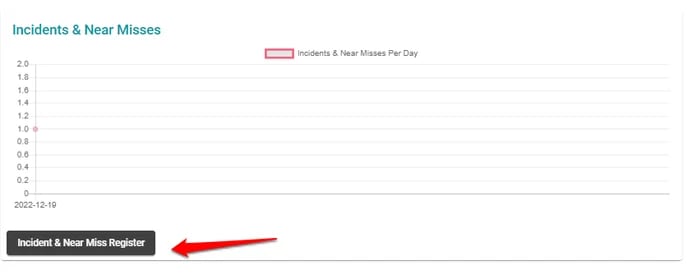
Incidents & Near Misses
Next to the Hazards & Risks Dashboard report, you will see a similar report for Inductions & Near Misses which also shows how many of these are logged per day.
You can also click the Incident & Near Miss Register button at the bottom of this graph to bring up your Incidents page in your account. For more information on this feature please click here.
Your Connected Network
Scrolling down, you will come to a Pie Graph which will show the ratio in your connected network of Contractor Businesses to User numbers.
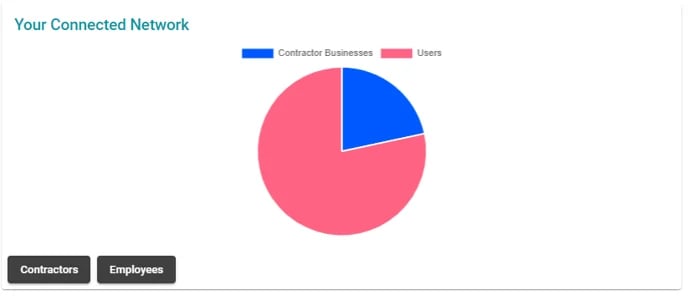
You will also be able to click the Contractors or Employees buttons below this graph to access your account lists for each category.
Inductions
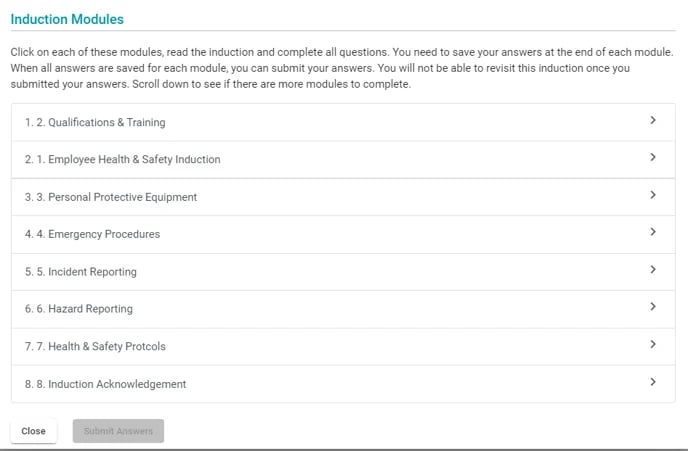
Scrolling further down, you will see a list of Inductions that need to be completed in your account
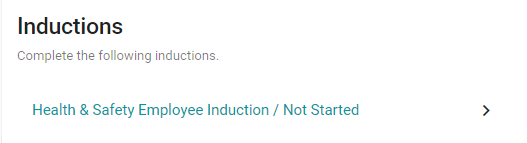
Click on the blue Induction link to bring up the modules which you need to complete.
This list will also appear on the Dashboards of any new employees you add to your connected network.
If you are an Admin user, this can also act as a guide or list of sorts that shows you what inductions need to be completed by your employees and Contractors when they register for the SiteConnect mobile app.
To learn how to add a new induction, click here.
If you need any further help or have any questions please contact the support team by email siteconnectsupport@sitesoft.com or Ph: 0800 748 763