The charts listed below were introduced into the software in May 2024. There are many more charts that are yet to be developed. All charts are filtered by a date range of 3 years by default. The user can specify their own date ranges which can exceed 3 years if needed. Each module has its own set of Charts that can be filtered.
The Dashboard Module allows users to filter charts by date range and/or selected sites. The Multi-Account Dashboard allows users to filter charts by date range and/or selected accounts that they are associated with.
Index:
- Access Activities Charts
- Forms Charts
- Hazards & Risks Charts
- Incidents Charts
- Inductions Charts
- Inspections & Audits Charts
- Messages Charts
- Safety Observations Charts
- Project/Sites Charts
- Tasks Charts
- Toolbox Talks Charts
Access Activities Charts
Access Activities by Type (Line Chart)
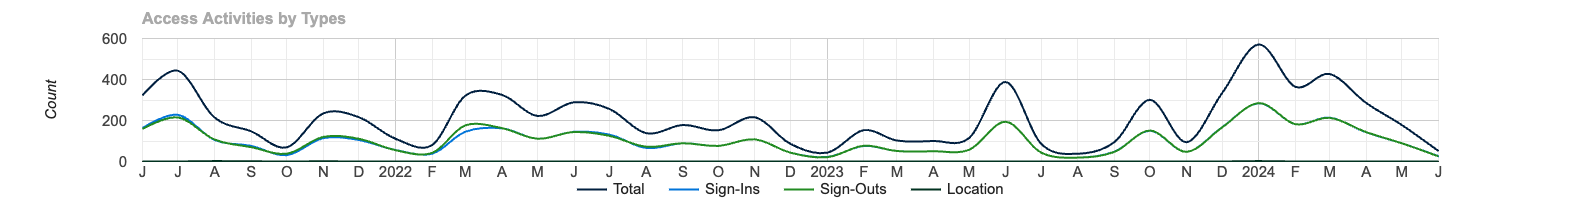
The access activities by types line chart shows a monthly summary of user sign-in and sign-out activities. The total is a count of both sign-in, sign-out and location-based activities. Sign-ins, sign-outs and location-based activities each have their own totals plotted on the line chart and adjust automatically based on how users sign in and out of sites.
Access Activities by Method (Pie Chart)
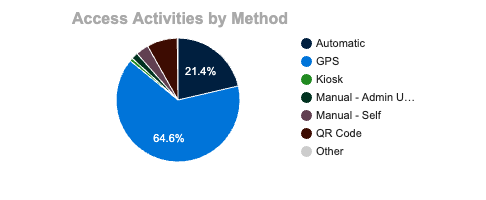
The access activities by method pie chart shows a breakdown of which methods were used to sign into and out of sites.
Access Activities by Acknowledgement Status (Pie Chart)
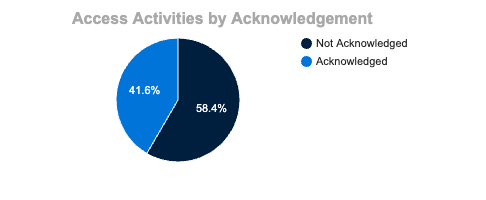
The access activities by acknowledgement pie chart shows a breakdown of how many users acknowledged their sign-in acknowledgements over time. This chart comes with a control to only show data for users currently onsite or all users regardless of onsite status.
Forms Charts
Historical Assigned Forms (Bar Chart)
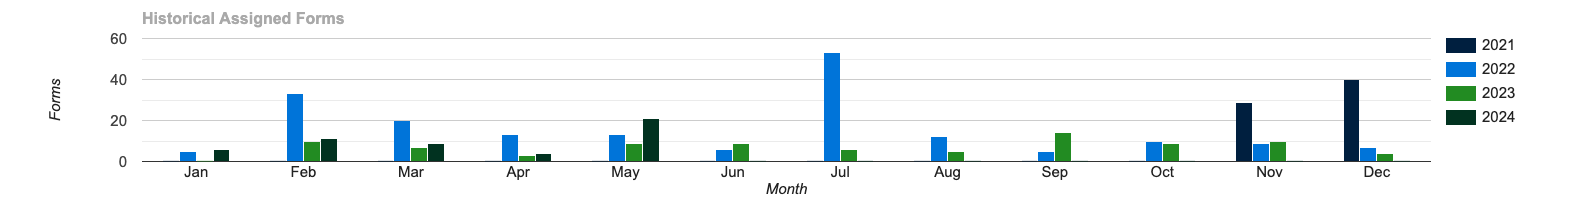
The historical assigned forms bar chart shows a monthly summary of forms that were assigned to users over a time period.
Template Forms Stats (Data Table)

The template forms stats count all assigned forms that were created from those templates which are grouped by form status. Each status has its own column with the total number of forms that were created from that template. The data table matches forms by name e.g. if an assigned form’s name starts with the name of the template form, it will be included in the count.
Assigned Forms Stats (Data Table)

The assigned forms stats data table shows a count of all assigned forms to users which are grouped by form status. Each status reflects the number of users that are assigned to the form.
Assigned Forms by Categories Stats (Data Table)

The assigned forms by categories data table shows a count of all forms that are assigned to users which are grouped by form statuses for each category. A form can be assigned to multiple categories. Each status reflects the number of users that are assigned to the form.
Hazards & Risks Charts
Historical Hazards & Risks (Bar Chart)
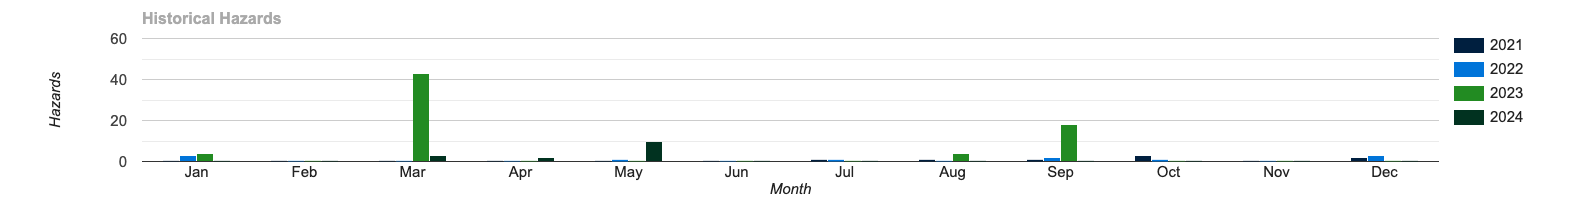
The historical hazards & risks bar chart shows the total number of hazards reported across all sites which are grouped by month over a time period.
Risk Matrix (Data Table)

The risk matrix data table shows a count of all hazards for each risk level. The data table is configurable to show a count of all hazards for both initial and residual risk assessments, either combined or individually.
Hazards & Risks by Status (Pie Chart)

The hazards & risks by status pie chart shows how many hazards are verified vs. not verified in the account.
Incidents Charts
Historical Incidents (Bar Chart)
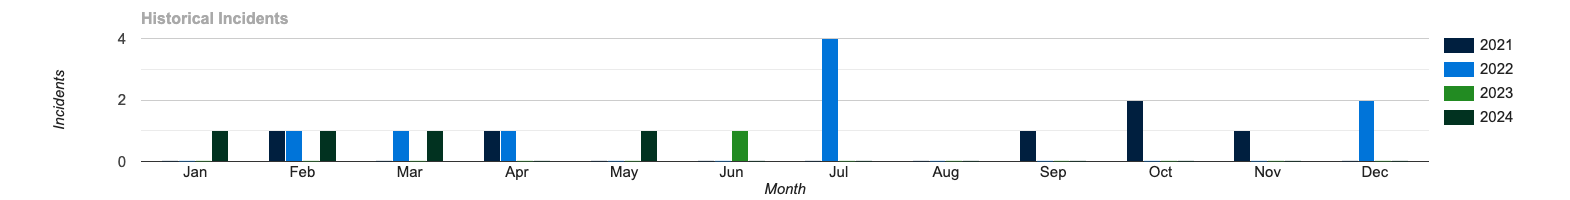
The historical incidents bar chart shows a total count of incidents reported which are grouped by month over a time period.
Incidents by Types (Pie Chart)

The incidents by types pie chart shows a breakdown of incidents which are grouped by types over a time period.
Incidents by Treatments (Pie Chart)

The incidents by treatments pie chart shows a breakdown of incidents which are grouped by treatments over a time period.
Incidents by Body Parts (Pie Chart)
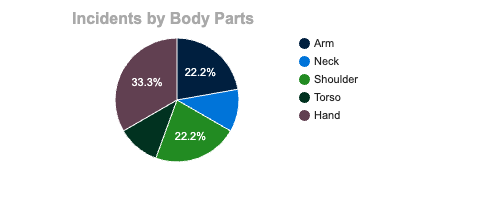
The incidents by body parts pie chart shows a breakdown of incidents which are grouped by body parts. A single reported incident can have many body parts selected.
Incidents by Status (Pie Chart)
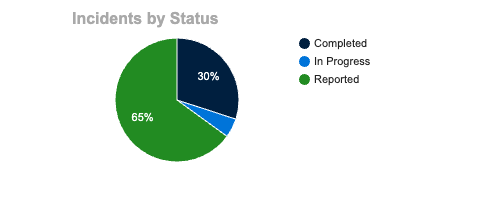
The incidents by status pie chart gives a breakdown of incidents which are grouped by statuses.
Incidents Stats (Data Table)

The incidents stats data table shows a summary of total incidents, LTI (Lost Time due to Injury) incidents and a count of completed and not completed incidents.
Incidents by Type (Bar Table)

The incidents by type bar chart shows a count of incidents which are grouped by a selected type. This chart is configurable to allow the user to select which type to filter incidents by.
Inductions Charts
Inductions Stats (Data Table)

The inductions stats data table shows summarized information based on how many users were assigned to the induction and how many users completed the induction vs. how many users have not completed the induction. The percent completed % column shows what percentage % of users completed the inductions vs. what percentage % of users did not complete the inductions.
Inspections & Audits Charts
Historical Inspections & Audits (Bar Chart)

The historical inspections & audits bar chart shows the total number of inspections & audits which are grouped by month over a time period.
Inspections & Audits by Templates Stats (Data Table)

The inspections & audits by template stats data table shows how many inspections & audits were created from the templates and how many inspections & audits were completed vs. not completed. The percentage completed % column shows the percentage of inspections & audits completed vs. not completed.
Messages Charts
Historical Messages (Bar Chart)
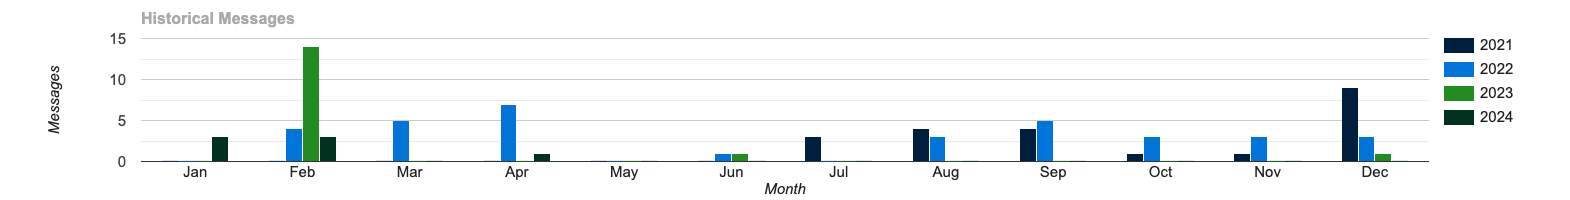
The historical messages bar chart shows the total number of messages which are grouped by month over a time period.
Messages by Status (Pie Chart)

The messages by status pie chart shows a breakdown of messages which are grouped by status over a time period.
Messages by Priorities (Pie Chart)

The messages by priorities pie chart shows a breakdown of messages which are grouped by priorities over a time period.
Messages by Types (Pie Chart)
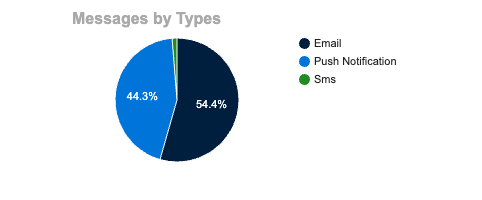
The messages by types pie chart shows a breakdown of messages which are grouped by types over a time period.
Safety Observations Charts
Historical Safety Observations (Bar Chart)
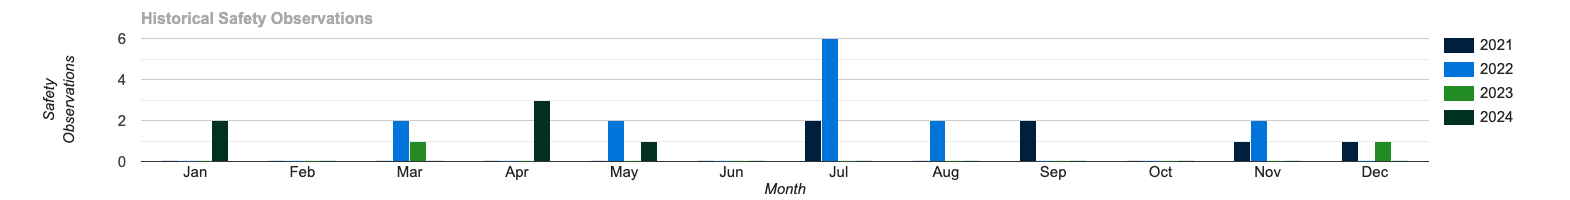
The historical safety observations bar chart shows the total number of reported safety observations which are grouped by month over a time period.
Safety Observations bt Category (Pie Chart)
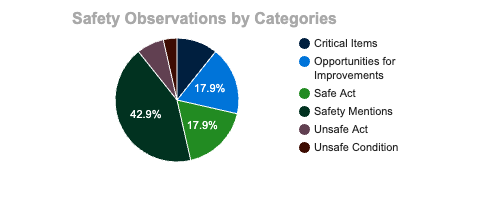
The safety observations by categories pie chart shows a breakdown of reported safety observations which are grouped by category over a time period.
Safety Observations by Types (Pie Chart)
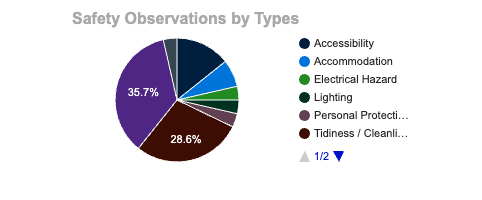
The safety observations by types pie chart shows a breakdown of reported safety observations which are grouped by types over a time period.
Safety Observations by Statuses (Pie Chart)
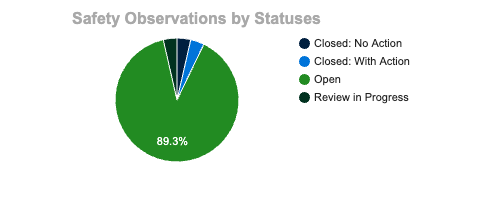
The safety observations by status pie chart shows a breakdown of reported safety observations which are grouped by status over a time period.
Safety Observations by Priorities (Pie Chart)

The safety observations by priority pie chart shows a breakdown of reported safety observations which are grouped by priority over a time period.
Safety Observations Corrective Actions by Statuses (Pie Chart)
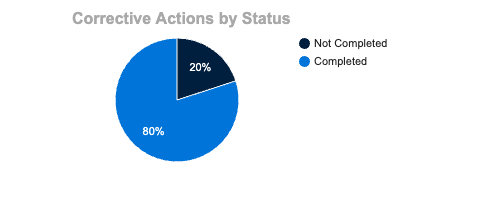
The safety observations corrective actions by status pie chart shows a breakdown of the statuses of corrective actions that are associated with safety observations which are grouped by corrective action statuses over a time period.
Safety Observations Stats (Data Table)
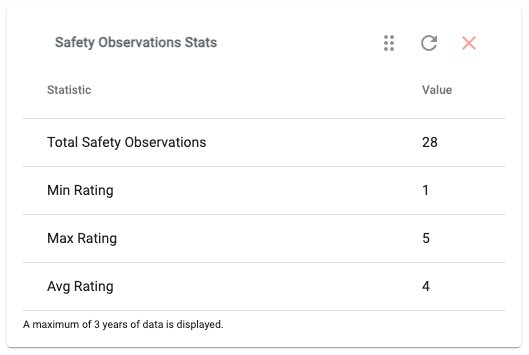
The safety observations stats data table shows summarized information like the total number of reported safety observations over a time period as well as the minimum, maximum and average rating of reported safety observations.
Projects/Sites Charts
Historical Projects/Sites (Bar Chart)

The historical projects/sites bar chart shows a count of all sites which are grouped by month over a time period.
Projects/Sites by Risk Assessments (Pie Chart)
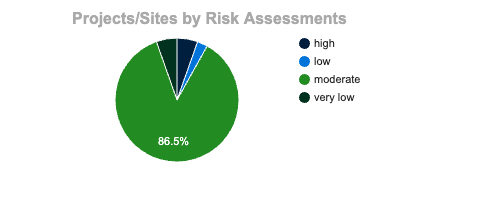
The projects/sites by risk assessments pie chart shows a breakdown of all projects/sites which are grouped by their risk assessment levels over a time period.
Projects/Sites by Status (Pie Chart)

The projects/sites by status pie chart shows a breakdown of all projects/sites which are grouped by projects/sites statuses over a time period.
Projects/Sites by Types (Pie Chart)
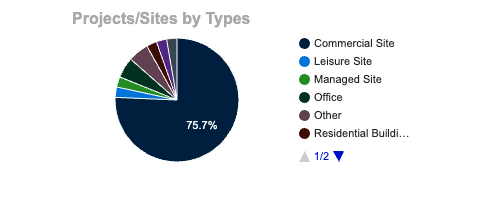
The projects/sites by types pie chart shows a breakdown of all projects/sites which are grouped by the projects/sites types over a time period.
Projects/Sites by Geofence Status (Pie Chart)

The projects/sites by geofence status pie chart shows a breakdown of all projects/sites which are grouped by the projects/sites geofence status e.g. what percentage of projects/sites have geofences vs. what percentage of projects/sites do not have geofences.
Projects/Sites by After Hours Notifications (Pie Chart)
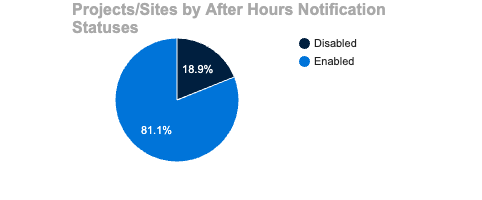
The projects/sites by after-hours notifications statuses pie chart shows a breakdown of all projects/sites which are grouped by the projects/sites after after-hours notifications statuses e.g. the percentage of projects/sites that have after-hours notifications enabled vs. the percentage of projects/sites that do not have after hours notifications enabled.
Projects/Sites by Tags (Stacked Bar Chart)
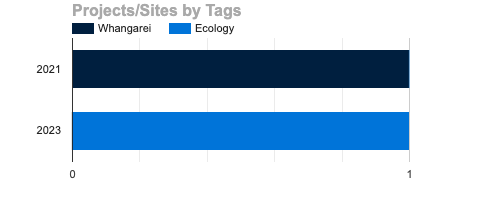
The projects/sites by tags stacked bar chart shows a count of sites that are tagged which are grouped by years. Projects/sites can have multiple tags. Each year will show its own list of tags next to each other with a numeric value associated with it.
Tasks Charts
Historical Tasks (Bar Chart)

The historical tasks bar chart shows a count of all tasks which are grouped by month over a time period.
Tasks by Status (Pie Chart)
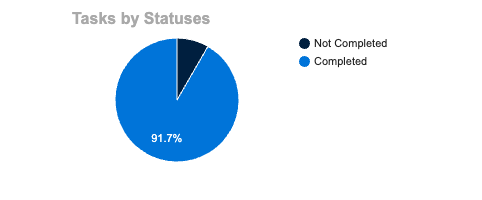
The tasks by status pie chart shows a breakdown of tasks which are grouped by statuses over a time period.
Tasks by Priorities (Pie Chart)

The tasks by priorities pie chart shows a breakdown of tasks which are grouped by priorities over a time period.
Toolbox Talks Charts
Historical Toolbox Talks (Bar Chart)

The historical toolbox talks bar chart shows a count of all toolbox talks which are grouped by month over a time period.